Key Takeaways & Executive Findings
- •• • South-facing orientation yields the highest daily power enhancement efficiency at 34.6%, compared to 23.1% (southwest), 16.7% (west), 11.9% (southeast), and 6.7% (east). This 5.2-fold spread between south and east directly impacts building energy yield calculations and PV window placement strategies for net-zero buildings. • • Inner surface cooling effect is highest for southeast (44.1%) and east (44.0%), exceeding west (41.7%), southwest (38.3%), and south (36.9%). Despite lower cooling percentages, south-facing windows achieve superior power gains due to higher cumulative irradiance, indicating that cooling percentage alone is a misleading performance metric. • • The ratio of heat removed by water to cumulative solar radiation ranks south > southeast > west ≈ southwest ≈ east, confirming that south-facing windows transfer more thermal energy per unit radiation. This has direct implications for combined PV-thermal (PVT) system design and heat recovery efficiency. • • Maximum power generation occurs at 13:10 for south, 16:00 for west, 14:45 for southwest, 09:20 for southeast, and 08:10 for east. The power variation characteristics are symmetric for south, ramp-up/steep-drop for west, and steep-rise/ramp-down for southeast and east, enabling predictive control of water flow scheduling.
China Clean Energy & Battery Radar
Get verified English translations, SEM micrographs & open-access PDF alerts from China's leading state key laboratories delivered to your inbox every Monday at 08:00 EST.
Abstract
This study addresses the absence of empirical data on how orientation affects cavity water cooling and power generation in hollow photovoltaic (PV) windows. Two identical experimental chambers were constructed on a rooftop in Xiamen, China, and tested under summer conditions. One chamber's window (Window A) received no water supply, while the other (Window B) was supplied with water at a constant flow rate via a bottom-inlet/top-outlet diagonal configuration. The hollow PV window comprised 6 mm ultra-clear tempered glass, a 12 mm air cavity, a 3.2 mm CdTe photovoltaic layer, and 6 mm ultra-clear tempered glass (total thickness 28.34 mm). Key parameters included a CdTe standard efficiency of 16.5%, temperature coefficient of -0.189%/°C, transmittance of 0.47, and coverage ratio of 0.6. Results show that cooling and power enhancement depend primarily on solar irradiance intensity, duration, and water supply temperature. The inner surface cooling effect ranked as southeast (44.1%) ≈ east (44.0%) > west (41.7%) > southwest (38.3%) > south (36.9%). Daily power enhancement efficiency ranked as south (34.6%) > southwest (23.1%) > west (16.7%) > southeast (11.9%) > east (6.7%). The ratio of heat change in inlet/outlet water to cumulative solar radiation ranked as south > southeast > west ≈ southwest ≈ east. The optimal orientation for cavity water-cooled PV windows in Xiamen is south-facing. These findings provide empirical benchmarks for integrating water-cooled PV windows into building envelopes.
1. Introduction
Building-integrated photovoltaic (BIPV) windows are a critical technology for achieving energy self-sufficiency in urban buildings. Unlike rooftop PV modules, PV windows operate under partial shading and elevated temperatures, which degrade electrical efficiency. Water cooling has emerged as a superior thermal management strategy compared to air cooling, owing to water's higher thermal conductivity and specific heat capacity. However, existing studies on water-cooled PV windows are predominantly simulation-based, with few field measurements, and none have systematically investigated the influence of orientation on cavity water cooling performance.
This study addresses that gap by constructing two identical experimental chambers on a rooftop in Xiamen, China. One chamber's hollow PV window (Window B) received constant-flow water cooling via a diagonal bottom-inlet/top-outlet configuration, while the other (Window A) served as an uncooled control. The window employed a CdTe photovoltaic layer with a standard efficiency of 16.5% and a temperature coefficient of -0.189%/°C. By comparing surface temperatures, power generation, and heat removal across five orientations (south, southwest, west, southeast, east), this work establishes empirical benchmarks for orientation-specific design and operation of water-cooled PV windows, providing actionable data for architects and HVAC engineers.
Loading authentic research manuscript (Pages 1–5)...
SHI Yuezhang, RAN Maoyu, XU Hang (2026). Comparative Experimental Study on Cooling and Power Generation of Cavity Water-Cooled Photovoltaic Windows Under Different Orientations. Acta Energiae Solaris Sinica. https://doi.org/10.19912/j.0254-0096.tynxb.202608_9678
Research & Educational Purpose Only: The translations, structured abstracts, analytical annotations, and data reports provided by SinoGreenTechare intended exclusively for academic research, internal corporate R&D, and educational benchmarking. They do not constitute formal engineering, chemical safety, legal, or professional advice.
Copyright & Intellectual Property Notice: Original copyright of the underlying source articles and experimental data remains with the respective authors, institutions, and original publishing journals. SinoGreenTech claims intellectual property only over its proprietary translations, analytical syntheses, and AEO structured enhancements in accordance with international fair use and academic citation principles.
Frequently Asked Questions
What is the dominant failure mechanism for CdTe photovoltaic layers under prolonged water cooling, and how does the temperature coefficient affect long-term degradation?
The CdTe layer has a temperature coefficient of -0.189%/°C, meaning power output decreases by 0.189% for every 1°C rise above 25°C. Water cooling mitigates this by reducing surface temperature, but prolonged exposure to water flow may induce thermal cycling stress and potential delamination at the glass-CdTe interface. The study does not report degradation rates over multiple years, but the observed daily power enhancement of up to 34.6% suggests that cooling effectively maintains the module near its optimal temperature. For industrial deployment, encapsulant materials must withstand continuous moisture exposure; accelerated aging tests are recommended to quantify lifetime derating.
How does the south-facing orientation achieve a 34.6% daily power enhancement despite having the lowest inner surface cooling percentage (36.9%)?
South-facing windows receive the highest cumulative solar irradiance over the day, which increases the absolute thermal load and thus the potential for cooling to recover efficiency. Although the percentage temperature reduction is lower (36.9% vs. 44.1% for southeast), the baseline temperature is higher, so the absolute temperature drop is greater, leading to a larger power gain. This non-linear relationship between cooling percentage and power enhancement is critical for system sizing: designers should prioritize orientations with high irradiance, not merely high cooling percentages.
What is the cost parity threshold for water-cooled PV windows compared to conventional air-cooled or uncooled PV windows in building retrofits?
The study does not provide a direct cost analysis, but the additional infrastructure (pump, piping, water tank, controls) adds capital cost. The daily power enhancement of 34.6% for south-facing windows translates to approximately 0.346 kWh extra per kWp per day under Xiamen summer conditions. Assuming a 20-year lifespan and current electricity tariffs, the payback period depends on the incremental cost. For high-rise buildings where window area is limited, the higher power density may justify the added cost. However, for low-rise or low-irradiance locations, air cooling or phase-change materials may offer better cost-benefit ratios.
How scalable is the diagonal bottom-inlet/top-outlet water flow configuration for large-area PV windows, and what are the pressure drop and flow distribution challenges?
The diagonal configuration ensures more uniform flow distribution than parallel or serpentine designs, but scaling to larger window areas (e.g., >2 m²) may cause maldistribution and dead zones. The study used a constant flow rate, but pressure drop across the 800 mm × 600 mm window was not reported. For commercial facades, multiple inlets/outlets or segmented channels would be necessary. Computational fluid dynamics (CFD) simulations should be performed to optimize manifold design and minimize pumping power, which can offset the electrical gains if not carefully managed.
What are the maintenance and water quality requirements to prevent fouling and scaling in the cavity, and how do they affect long-term performance?
The study used tap water without treatment, but in real installations, mineral scaling and biological growth can reduce heat transfer and block channels. Periodic cleaning or closed-loop water treatment with filters and anti-fouling additives is recommended. The cavity is 12 mm thick, which is prone to clogging if debris enters. A strainer and regular flushing schedule are essential. The impact on performance is not quantified in this study, but even a 1 mm scale layer can increase thermal resistance by an order of magnitude, potentially negating the cooling benefit. Future research should include water quality monitoring and maintenance protocols.
Related Chinese Research & Cross-Citations
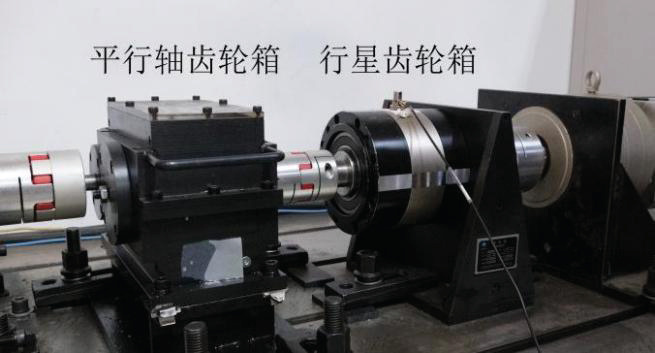
Wind Turbine Gearbox Fault Diagnosis Method Based on Improved CNN-XGBoost Fusion Model Under Gramian Angular Difference Field
Gearbox failures account for 20–30% of total wind turbine faults and incur maintenance costs equivalent to 10–15% of overall turbine value. Conventional vibration diagnostic pipelines—complementary ensemble empirical mode decomposition with singular value energy spectrum, time-varying filtering empirical mode decomposition, and Teager energy spectrum analysis—remain bounded below 90% accuracy and depend on expert-driven feature engineering that is sensitive to non-stationary operating conditions and noise. This study proposes an intelligent diagnostic architecture that converts one-dimensional gearbox vibration signals into two-dimensional images via Gramian angular difference field (GADF) transformation, preserving intrinsic temporal correlation and time-frequency structure while exploiting matrix sparsity to suppress interference. An improved convolutional neural network (CNN) extracts multi-dimensional features: a convolutional block attention module (CBAM) is embedded in the convolutional layers to weight critical channels and focus on fault-sensitive spatial regions, and a modified βc-ACONC activation function replaces ReLU to mitigate neuron necrosis and enable selective activation. The extracted composite features are then fed into an XGBoost network whose hyperparameters are optimized by an improved sparrow search algorithm (ISSA). Validation on a laboratory wind turbine gearbox dataset yields diagnostic accuracy exceeding 99%, demonstrating robust fault identification capability under complex operating conditions.
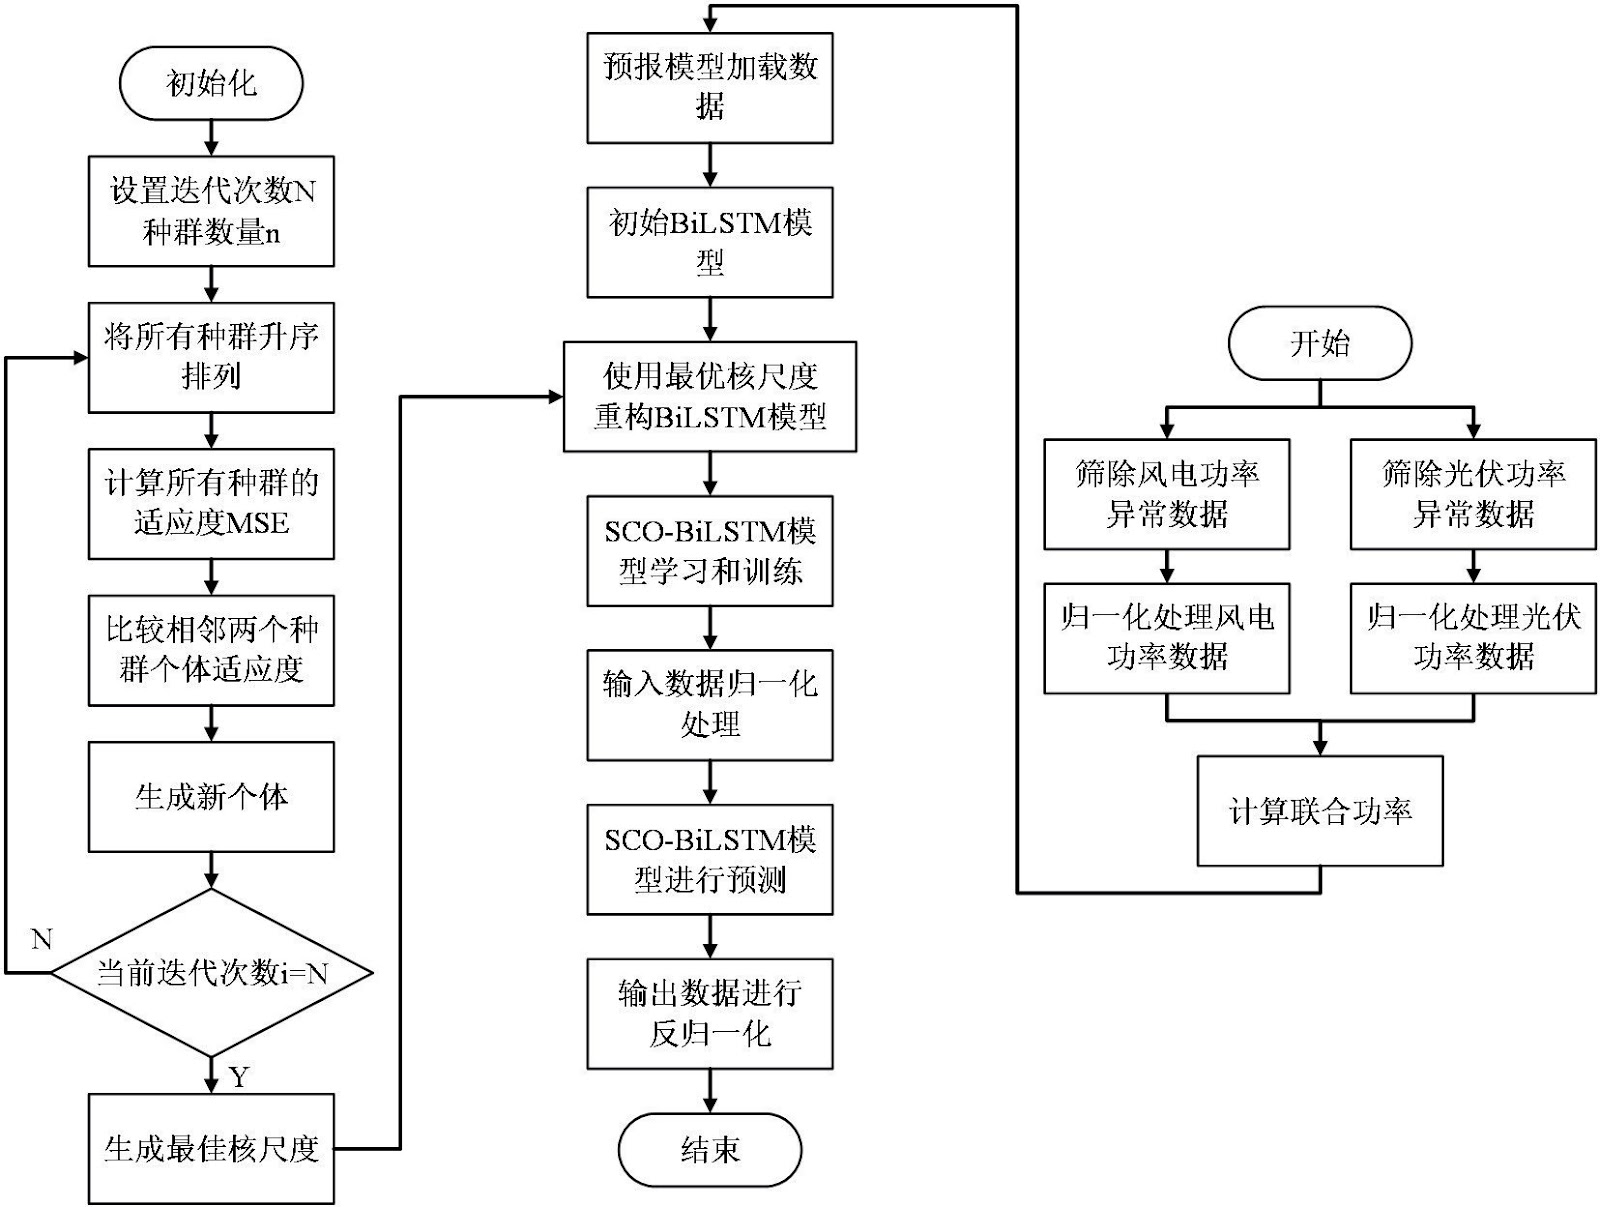
Joint Forecasting of Wind and Photovoltaic Power Considering Complementarity
The inherent spatiotemporal complementarity between wind and solar resources offers a theoretical basis for improving renewable power forecasting accuracy. This study proposes a joint wind-photovoltaic (PV) power forecasting strategy that explicitly exploits this complementarity. A bidirectional long short-term memory (BiLSTM) neural network serves as the baseline forecasting model, and a novel sorting and comparative optimization (SCO) algorithm is developed to optimize the model's hyperparameters. The SCO algorithm ranks individuals in ascending order and compares adjacent fitness values to escape local optima, a known deficiency in conventional metaheuristics such as genetic algorithms and particle swarm optimization. For wind farms and PV plants exhibiting significant complementarity, the joint forecasting strategy first aggregates their power outputs, normalizes the combined signal, and then feeds it into the optimized BiLSTM model. Experimental results demonstrate that the proposed SCO-BiLSTM model reduces the eMAPE by 10.313% compared with PSO-BiLSTM. Furthermore, joint forecasting under SCO-BiLSTM lowers the eRMSE by 27.443% relative to standalone PV power forecasting. The study also establishes that forecasting accuracy improves with stronger wind-solar complementarity but degrades as the forecasting horizon extends. These findings confirm that exploiting complementarity in joint forecasting substantially enhances predictive performance for renewable energy integration.
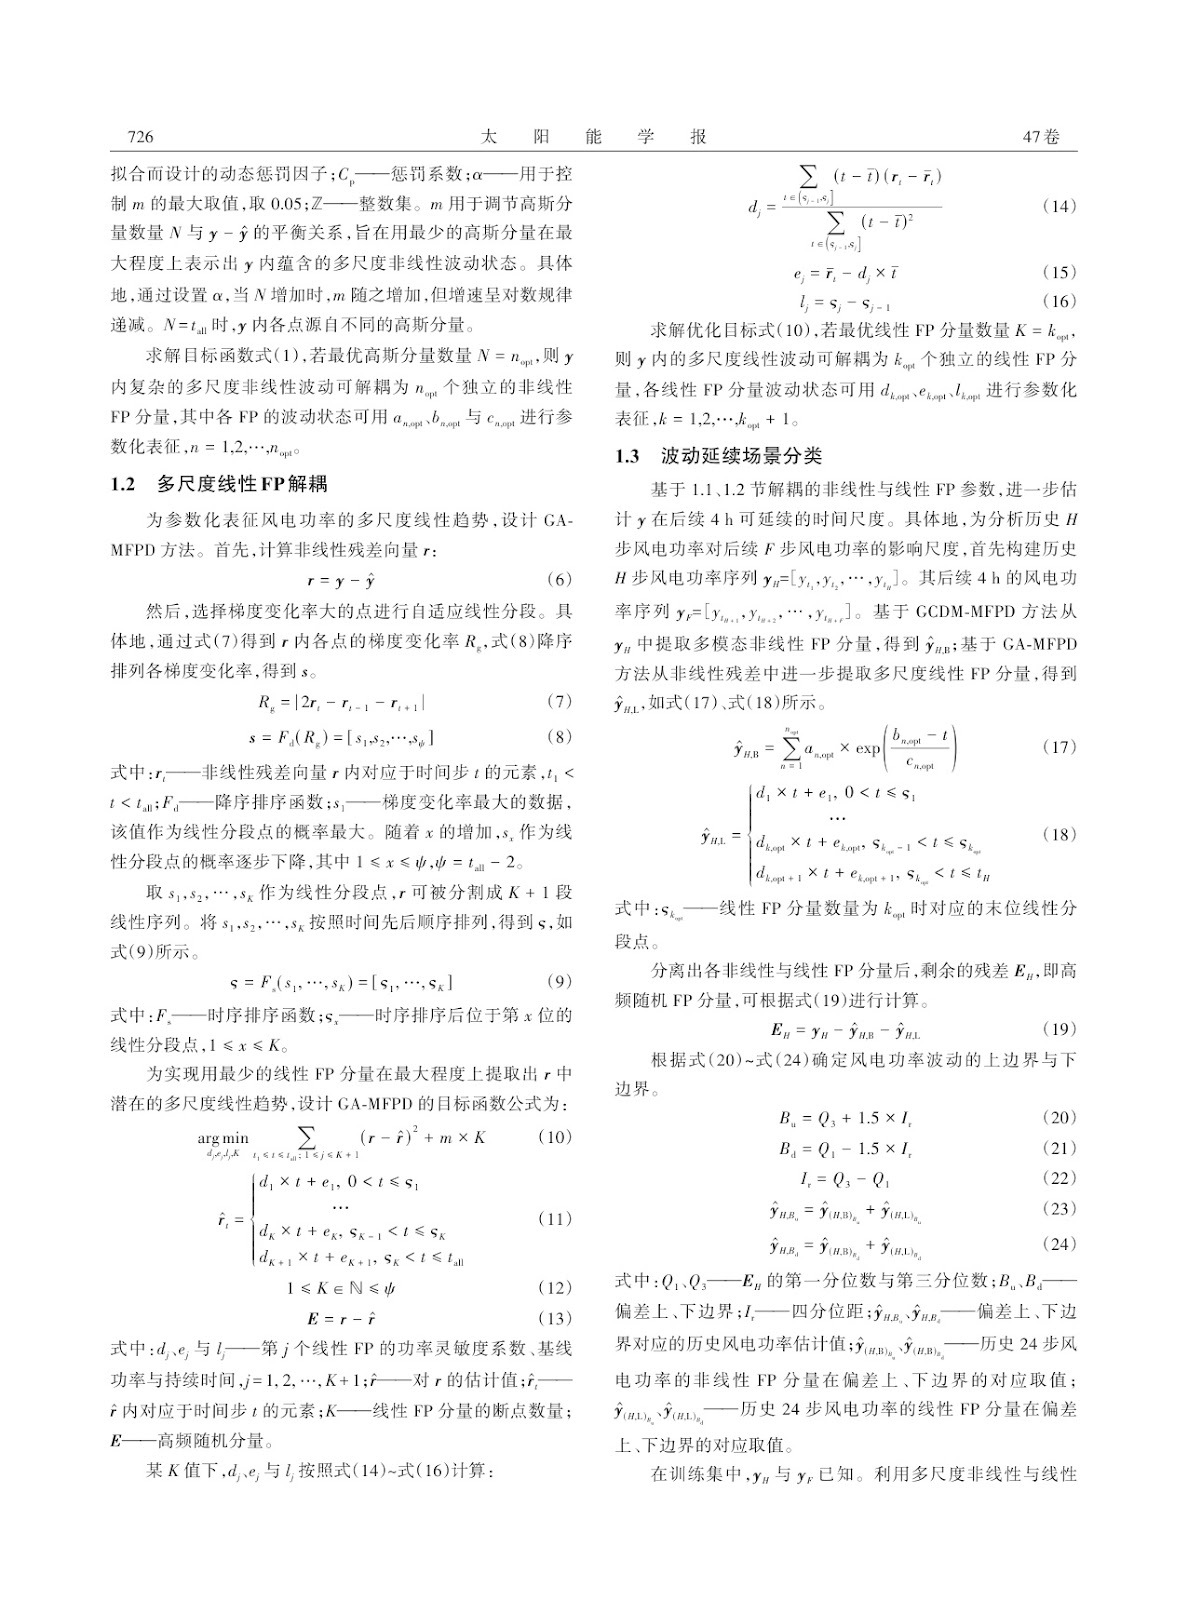
Ultra-Short-Term Wind Power Forecasting Based on Fluctuation Continuation Scenario Identification
Existing ultra-short-term wind power forecasting methods exhibit limited performance due to insufficient extraction of fluctuation information and inadequate analysis of evolution patterns. This paper proposes an ultra-short-term wind power forecasting method based on fluctuation continuation scenario identification. First, the coupling mechanism of wind power fluctuations under multiple turbulence processes is investigated, and historical wind power dynamics are decoupled into a combination of nonlinear and linear fluctuation components. A fluctuation continuation concept is introduced, and the future continuation scale of wind power fluctuations is derived from nonlinear and linear decoupling parameters, thereby classifying fluctuation continuation scenarios. A sparse neural network (SNN) oriented to high-dimensional sparse features is constructed to identify historical fluctuation continuation scenarios, and ultra-short-term power forecasting is conducted separately for each scenario. Validation using measured wind speed and power data from three wind farms shows that, compared with baseline models, the proposed model improves root mean square error (RMSE), mean absolute error (MAE), and mean absolute percentage error (MAPE) by at least 1.46%, 2.44%, and 14.67%, respectively, demonstrating superior accuracy and stability. The method addresses the limitations of signal decomposition techniques that lack physical interpretability and are sensitive to hyperparameters, and overcomes the high-dimensional sparsity challenges faced by traditional scenario identification models.
Multi-Classifier Open Adversarial Network for Rolling Bearing Fault Diagnosis in Wind Turbine Generator Systems
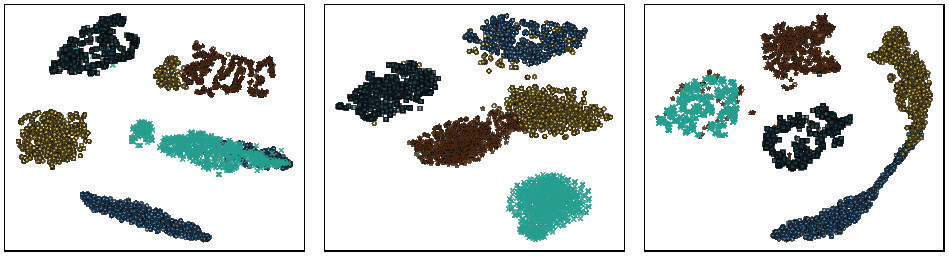
Rolling bearings in wind turbine generator systems operate under variable speed and load conditions that induce significant data distribution shifts between training and field data, while unknown fault modes absent from the source domain are frequently misclassified as known classes. This study proposes a multi-classifier open adversarial network (MCOAN) for open-set fault diagnosis. Within an adversarial domain adaptation framework, a K-way classifier and an additional K+1-way one-vs-all classifier independently estimate target-sample similarity to the source domain. These similarity scores drive a dynamic weighting mechanism that adaptively reweights target samples during open-set adversarial training and supplies per-sample dynamic thresholds for known/unknown discrimination, thereby promoting cross-domain alignment of shared-class features while suppressing negative transfer from unknown samples. A non-adversarial domain classifier is introduced to stabilize dynamic weight estimation. Validation on two datasets demonstrates high-precision shared-class distribution alignment and unknown-class recognition with favorable robustness. The method removes reliance on empirically preset thresholds that plague conventional open-set back-propagation approaches, where a fixed threshold of 0.5 in the binary cross-entropy adversarial loss provides no per-sample adaptivity. By coupling K-way and K+1-way similarity estimates, MCOAN achieves simultaneous known-class alignment and unknown-class separation without prior knowledge of the unknown-class cardinality, addressing a persistent bottleneck in wind turbine drivetrain condition monitoring where unanticipated bearing failure modes emerge under field conditions.
Unsupervised Automated Identification Method for Abnormal States of Wind Turbine Gearboxes
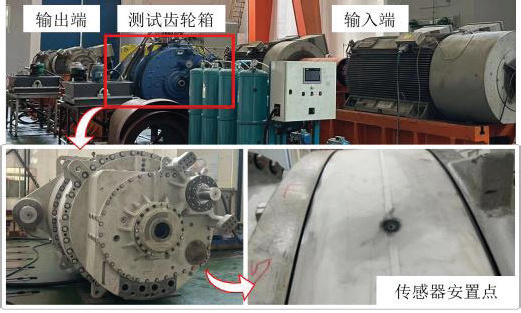
Addressing the scarcity of labeled data for training classification models in wind turbine planetary gearbox anomaly identification, this study proposes an unsupervised automated detection method. Log Mel-band energy features are extracted from raw vibration signals and fed into an unsupervised anomaly recognition model centered on a U-net autoencoder. A health-state threshold is established based on reconstruction error between model input and output, enabling anomaly identification. The method is validated using factory gearbox test data and operational data from a wind farm in Yangtouya, Shanxi. For factory gearboxes, dual validation is performed using a spectrum amplitude modulation-based signal processing method. Results demonstrate that the proposed method achieves 93.34% recognition accuracy on both factory and wind farm test sets, confirming its capability to automatically and correctly separate abnormal wind turbine gearboxes. The approach eliminates reliance on labeled fault data, offering a scalable solution for full-lifecycle health monitoring, from factory acceptance testing to in-service early anomaly detection, adaptable across different operating conditions and turbine models.
Improved Adaptive Super-Twisting Sliding Mode Control for Permanent Magnet Synchronous Motors
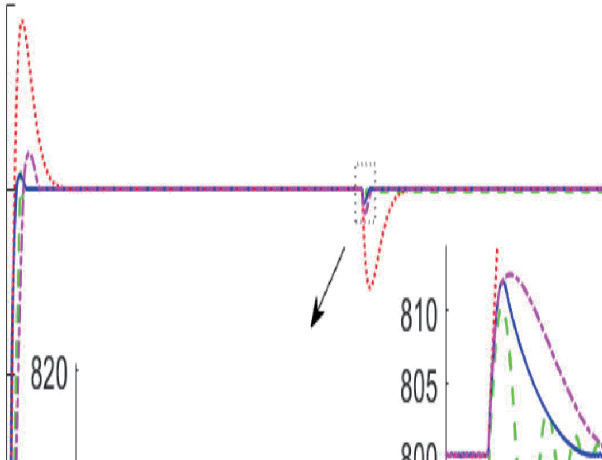
Adaptive super-twisting sliding mode control (ASTSMC) for permanent magnet synchronous motors (PMSM) suffers from prolonged convergence and insufficient disturbance rejection under complex operating conditions. This paper proposes an improved ASTSMC incorporating a fixed-time disturbance observer (FTDO). A power term is introduced into the adaptive super-twisting controller to accelerate convergence far from the origin, while the discontinuous sign function is replaced by a continuous h(s) function to mitigate chattering. The FTDO ensures disturbance estimation converges within a fixed time independent of initial states, overcoming the limitations of traditional and finite-time observers. The estimated disturbance is fed forward to the sliding mode controller for compensation, enhancing robustness. The FTDO design is based on an auxiliary state variable z and its derivative, with error dynamics analyzed via Lyapunov stability. Comparative simulations against conventional disturbance observers and sliding mode controllers validate the proposed strategy. The results demonstrate shorter convergence time, improved dynamic performance, and superior disturbance rejection, making the approach suitable for high-performance servo systems. The method addresses the critical need for robust, fast-response control in electric vehicles, rail transit, and aerospace applications where PMSM drives face significant uncertainties and external disturbances.